Overview

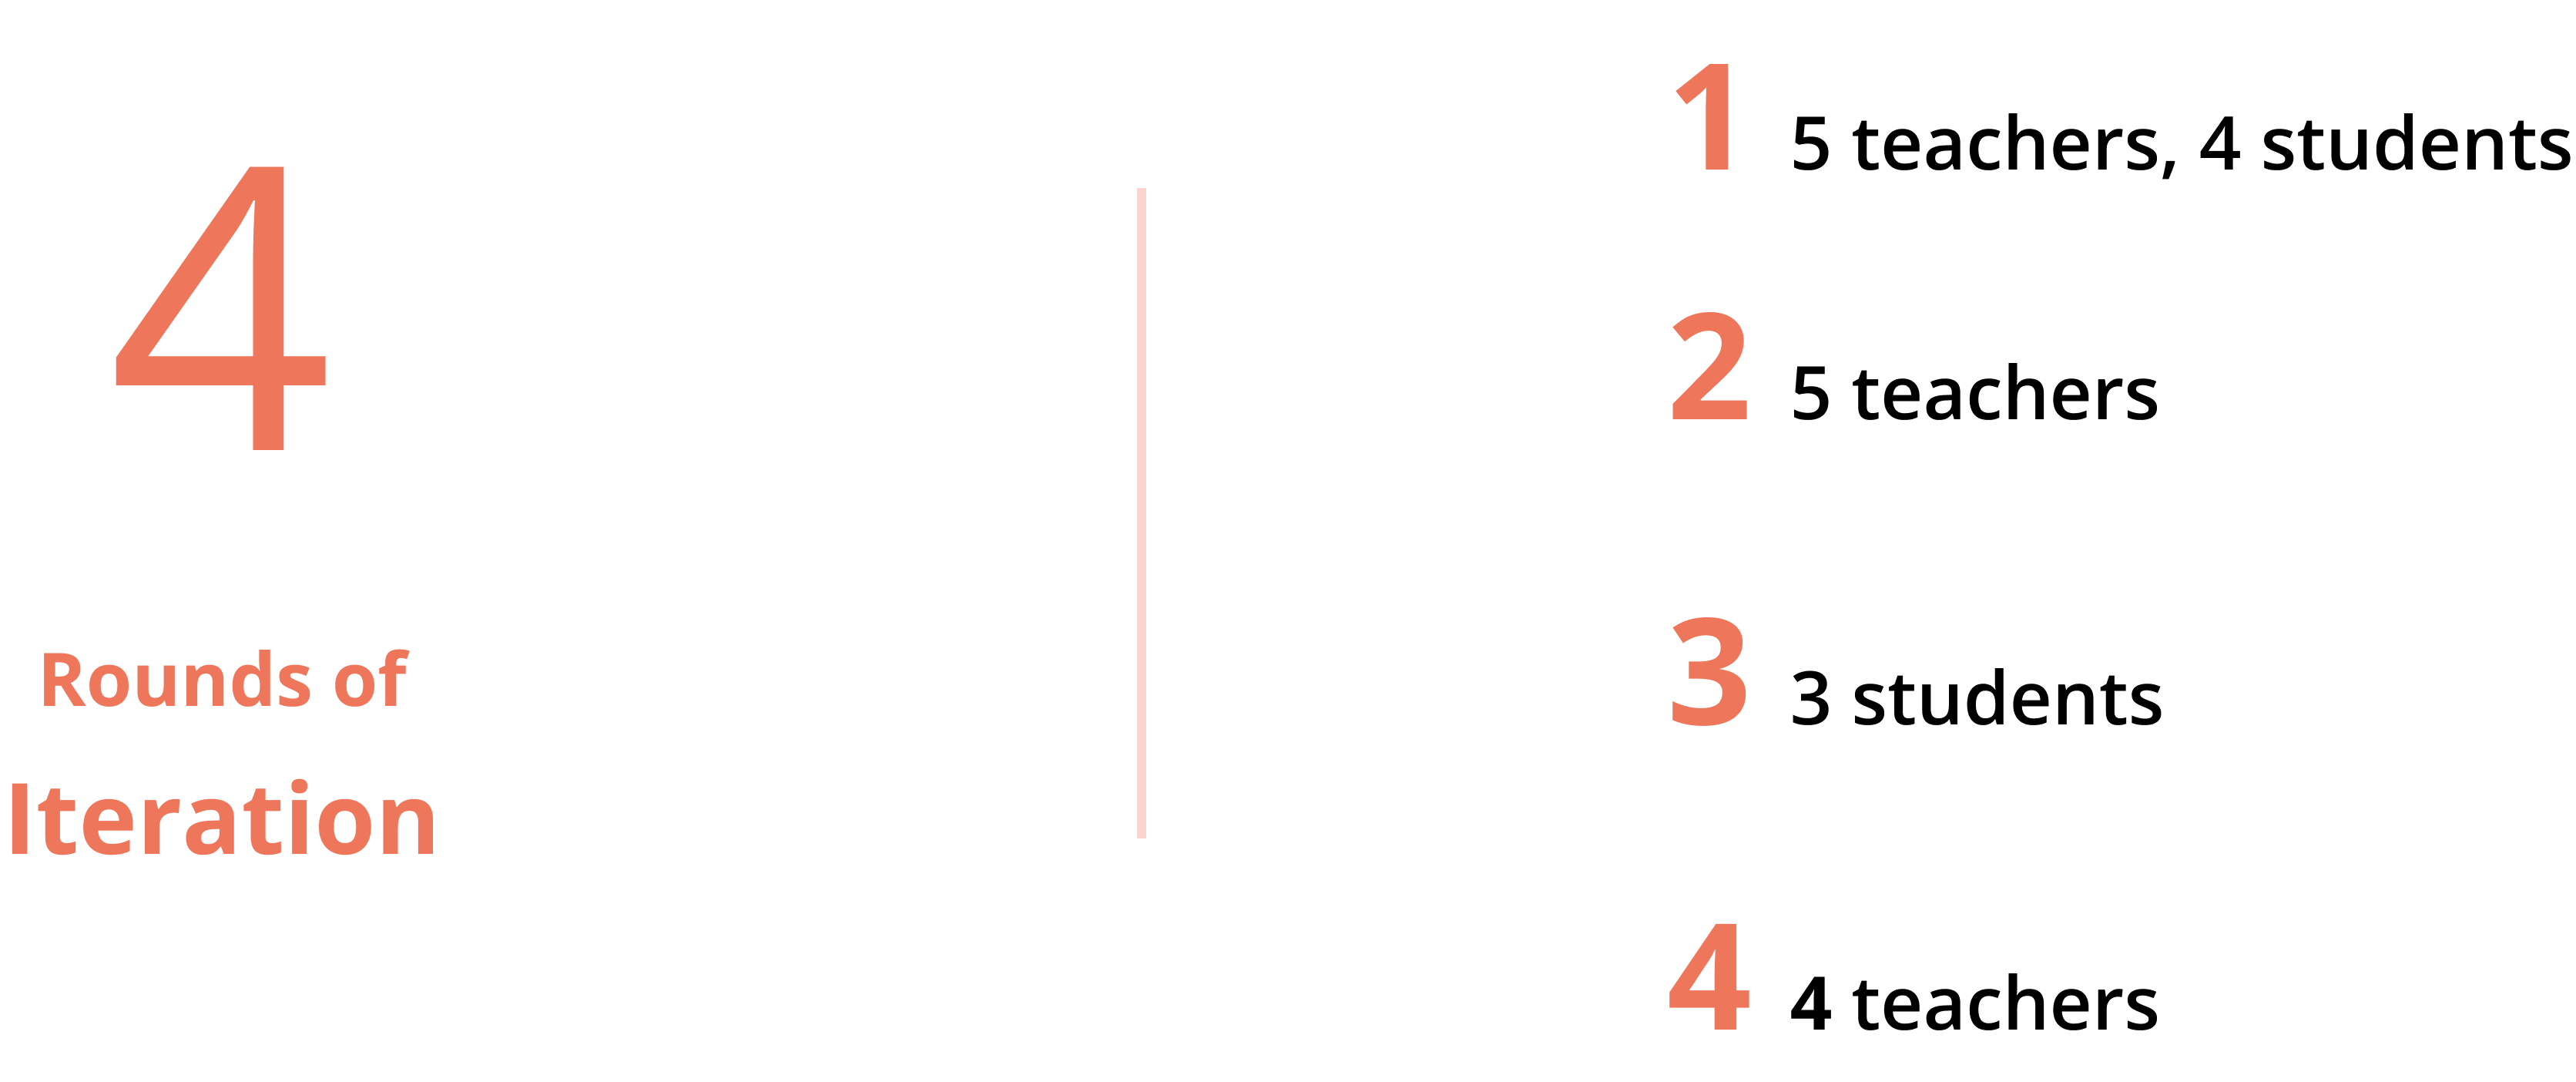
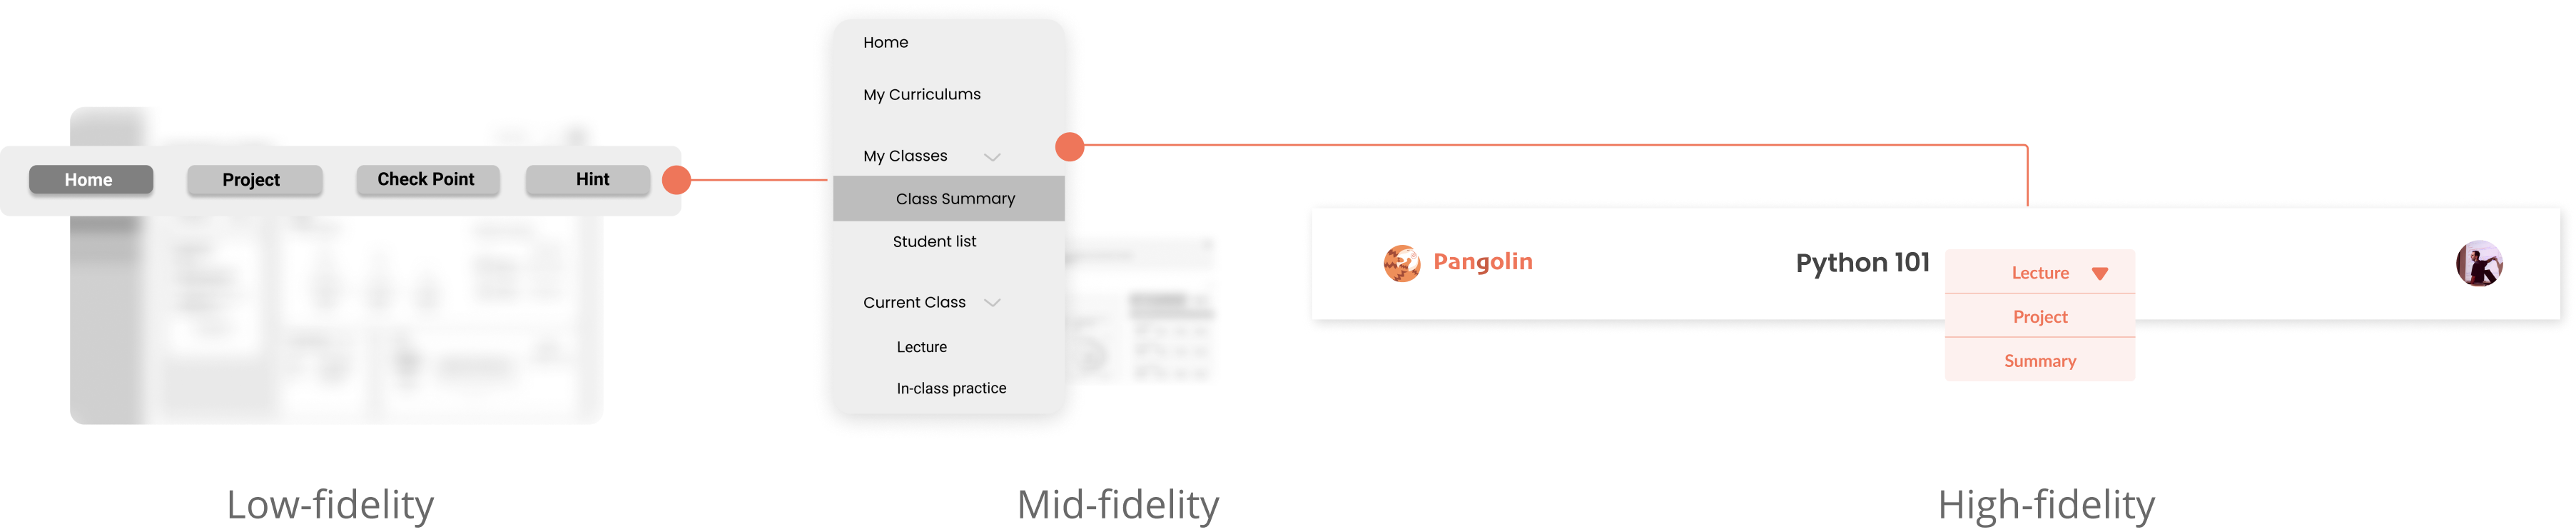
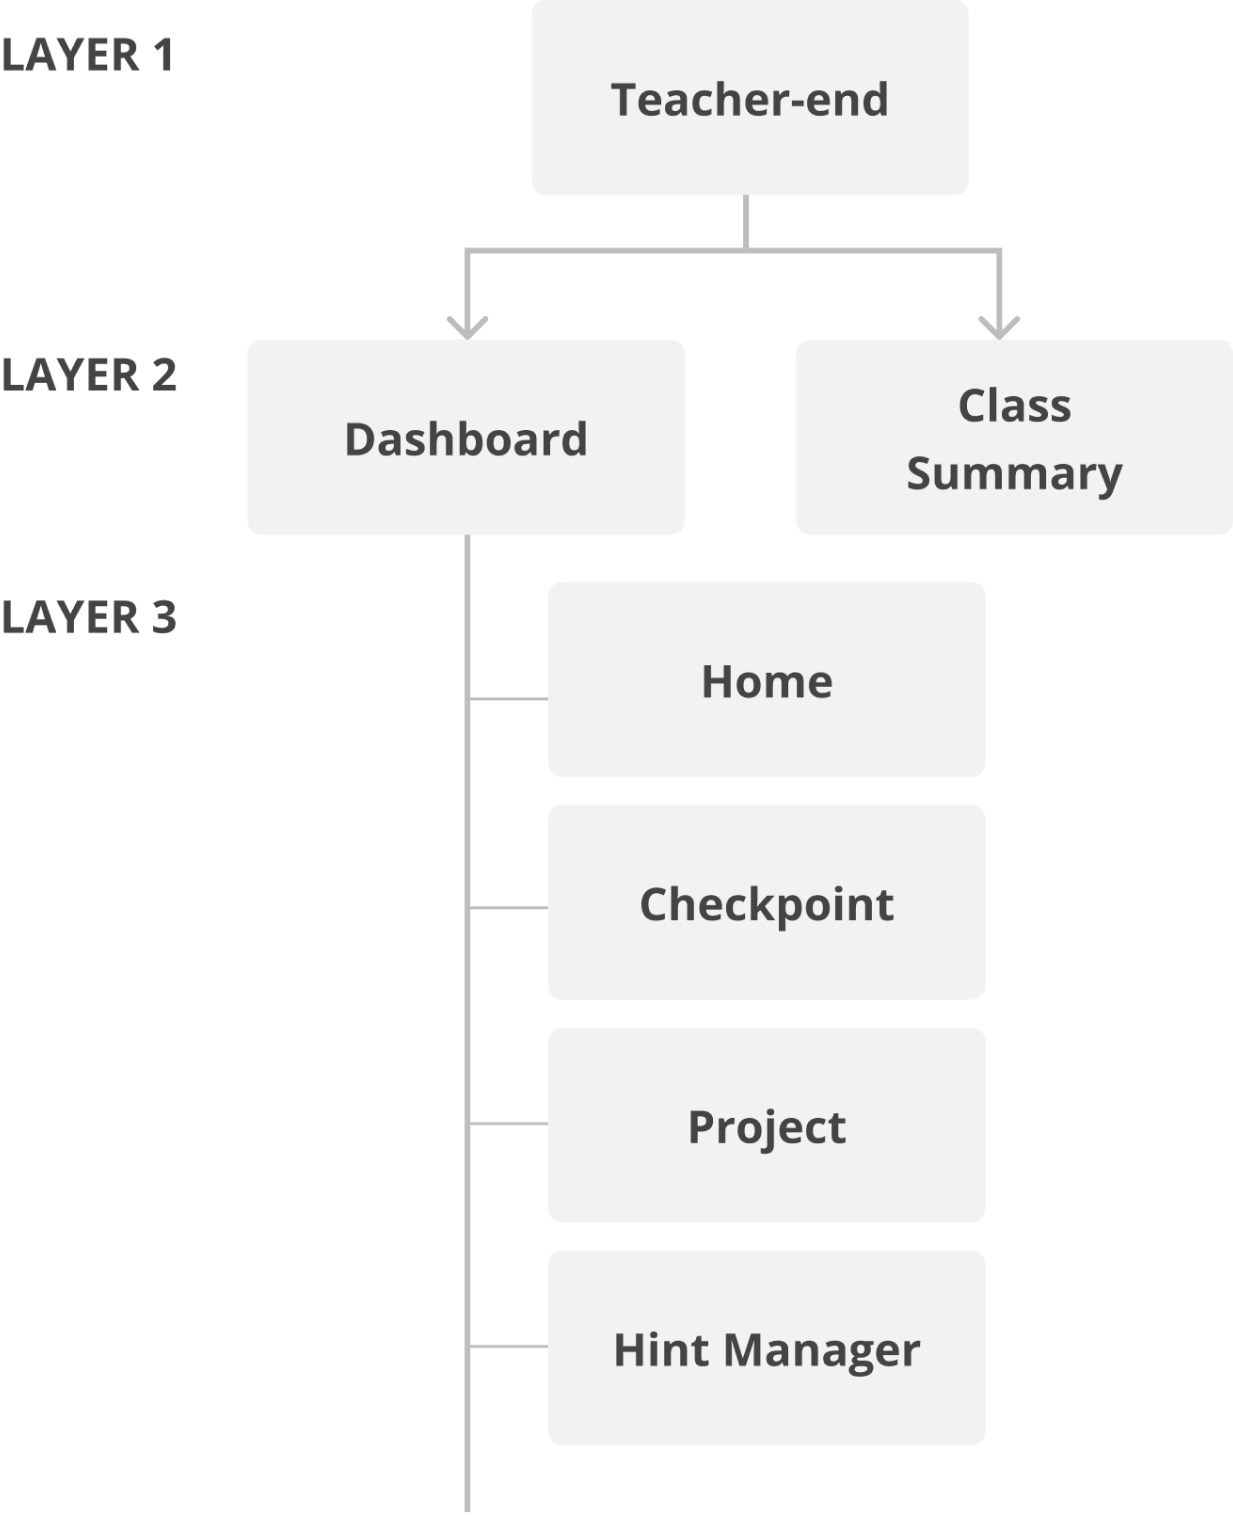
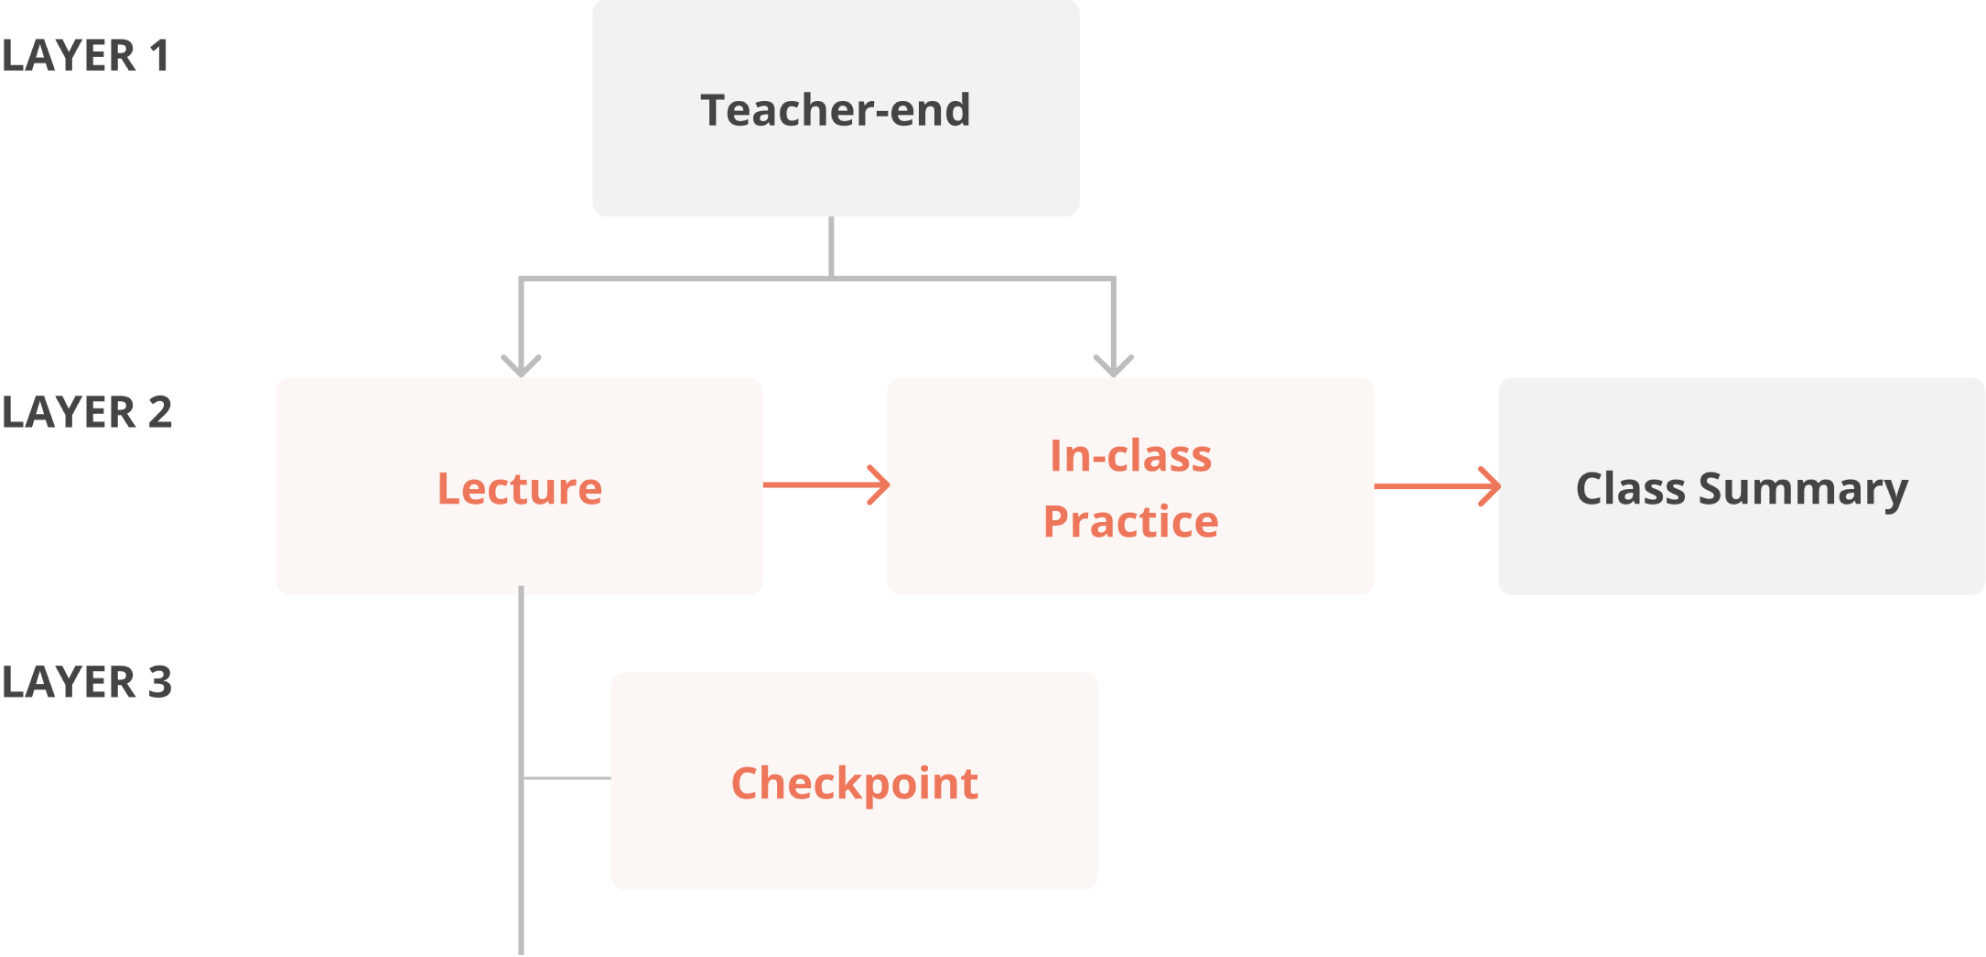
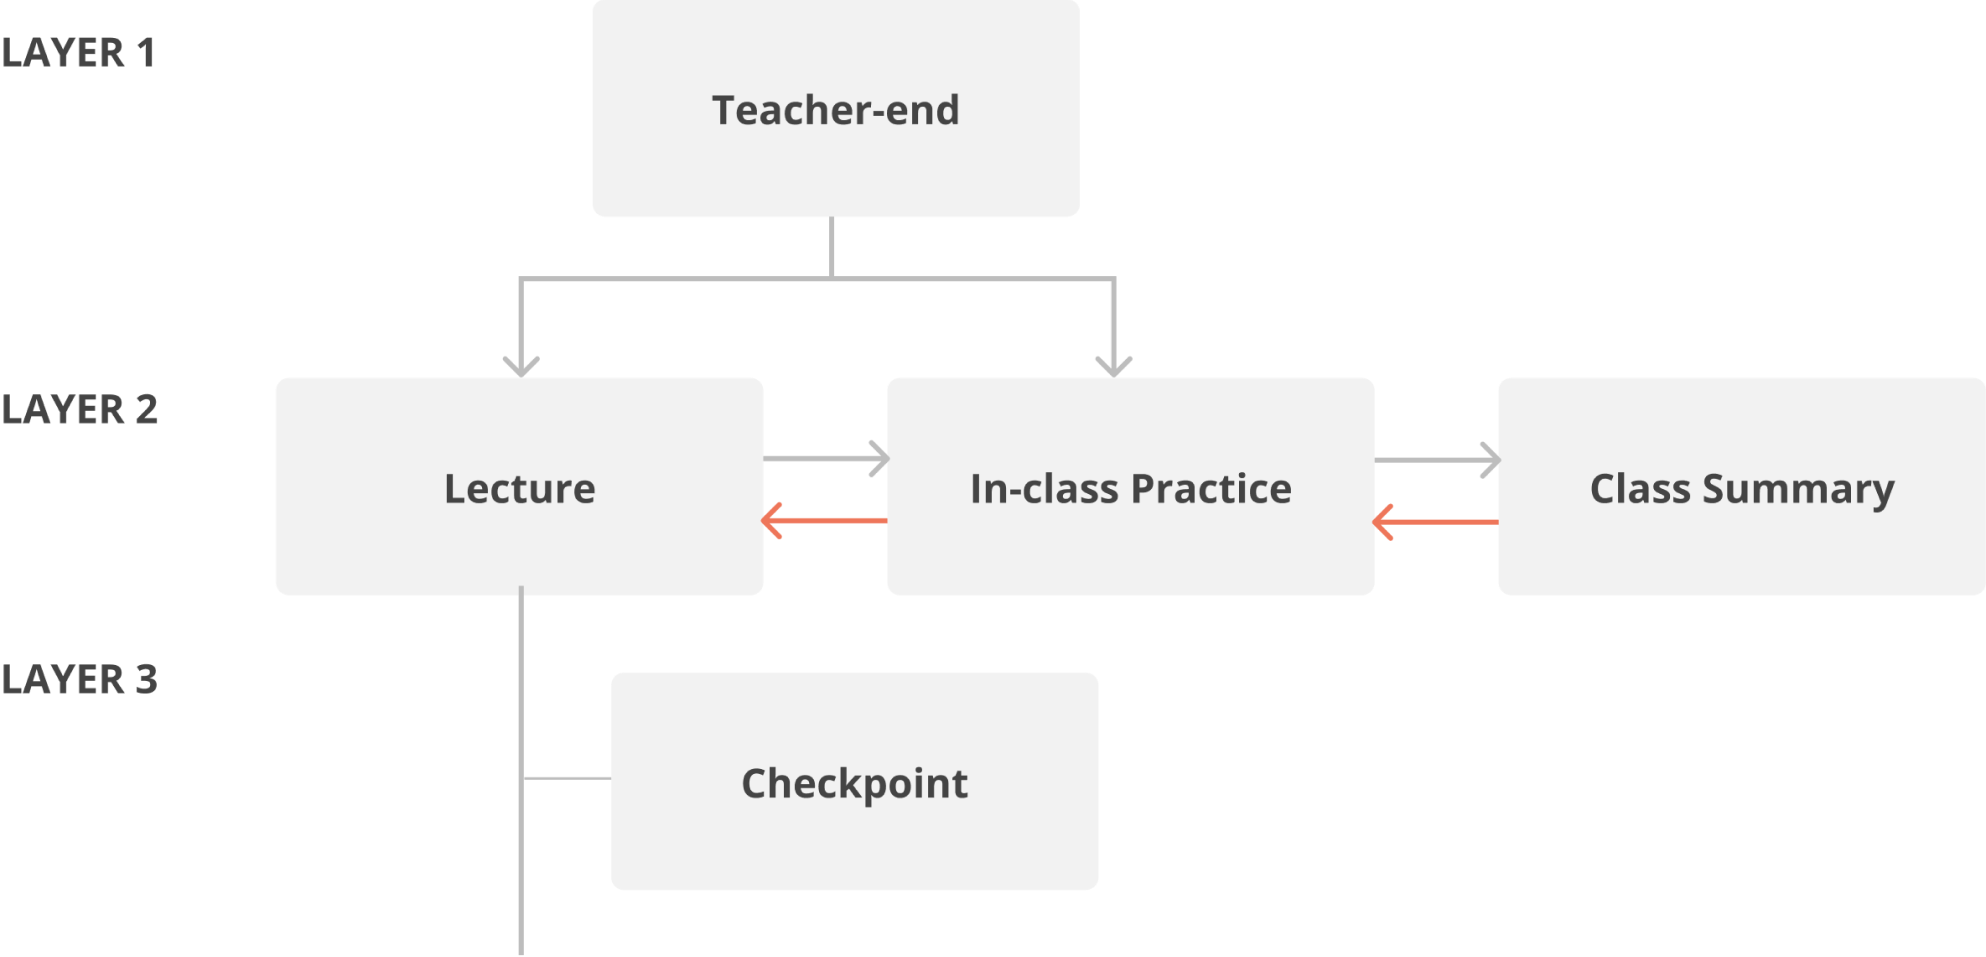
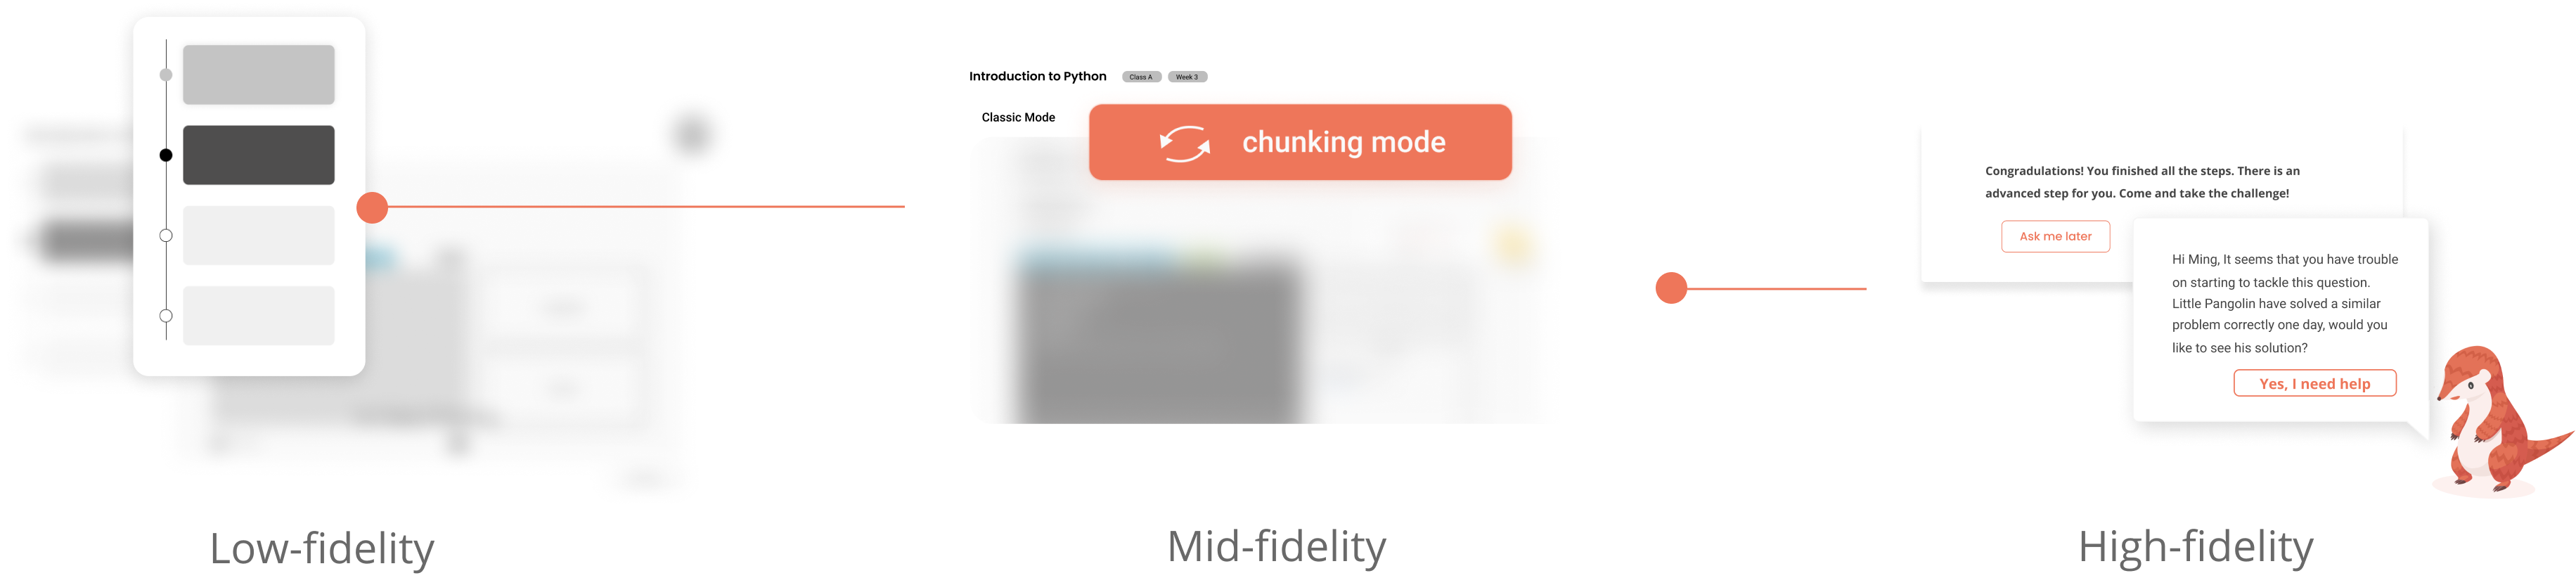
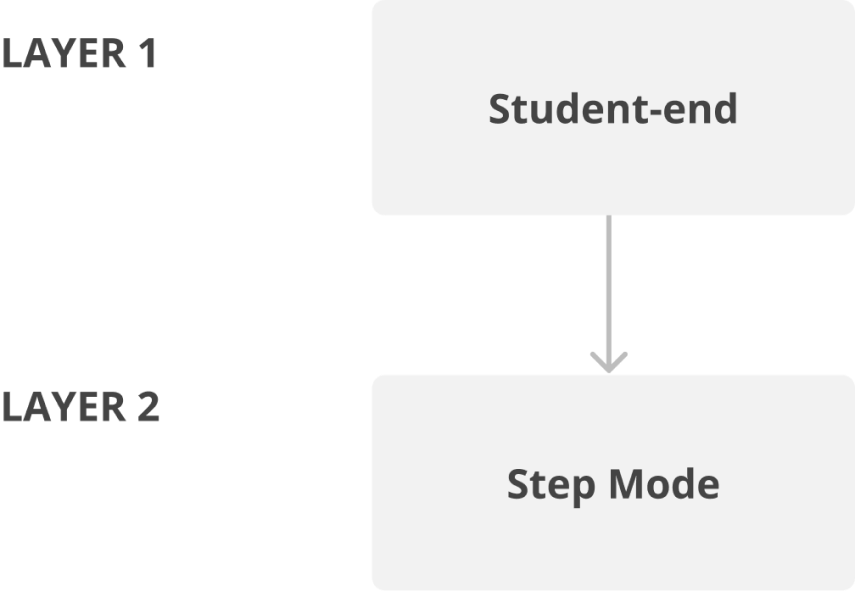
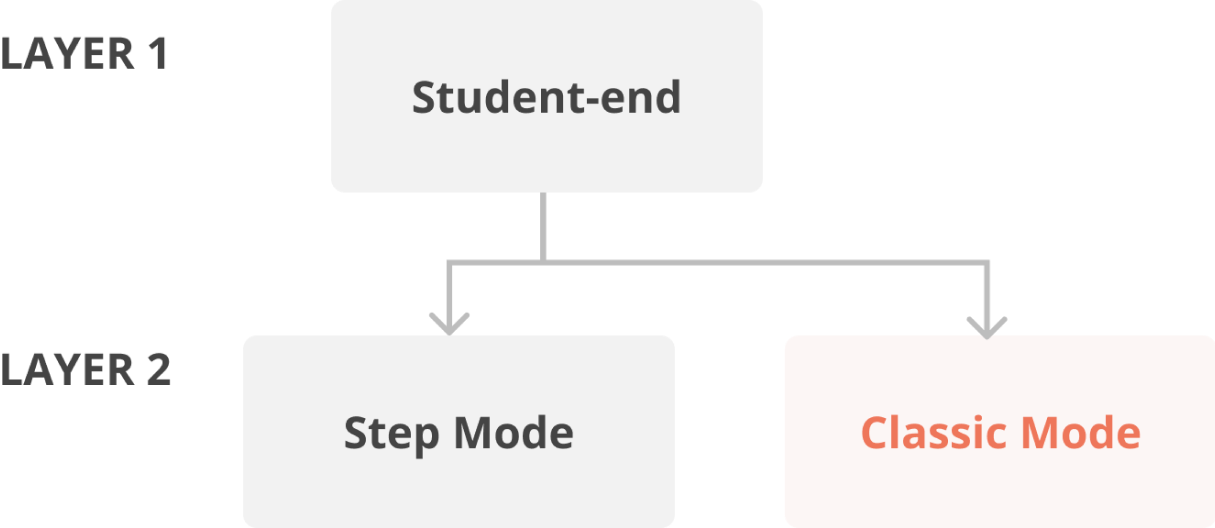
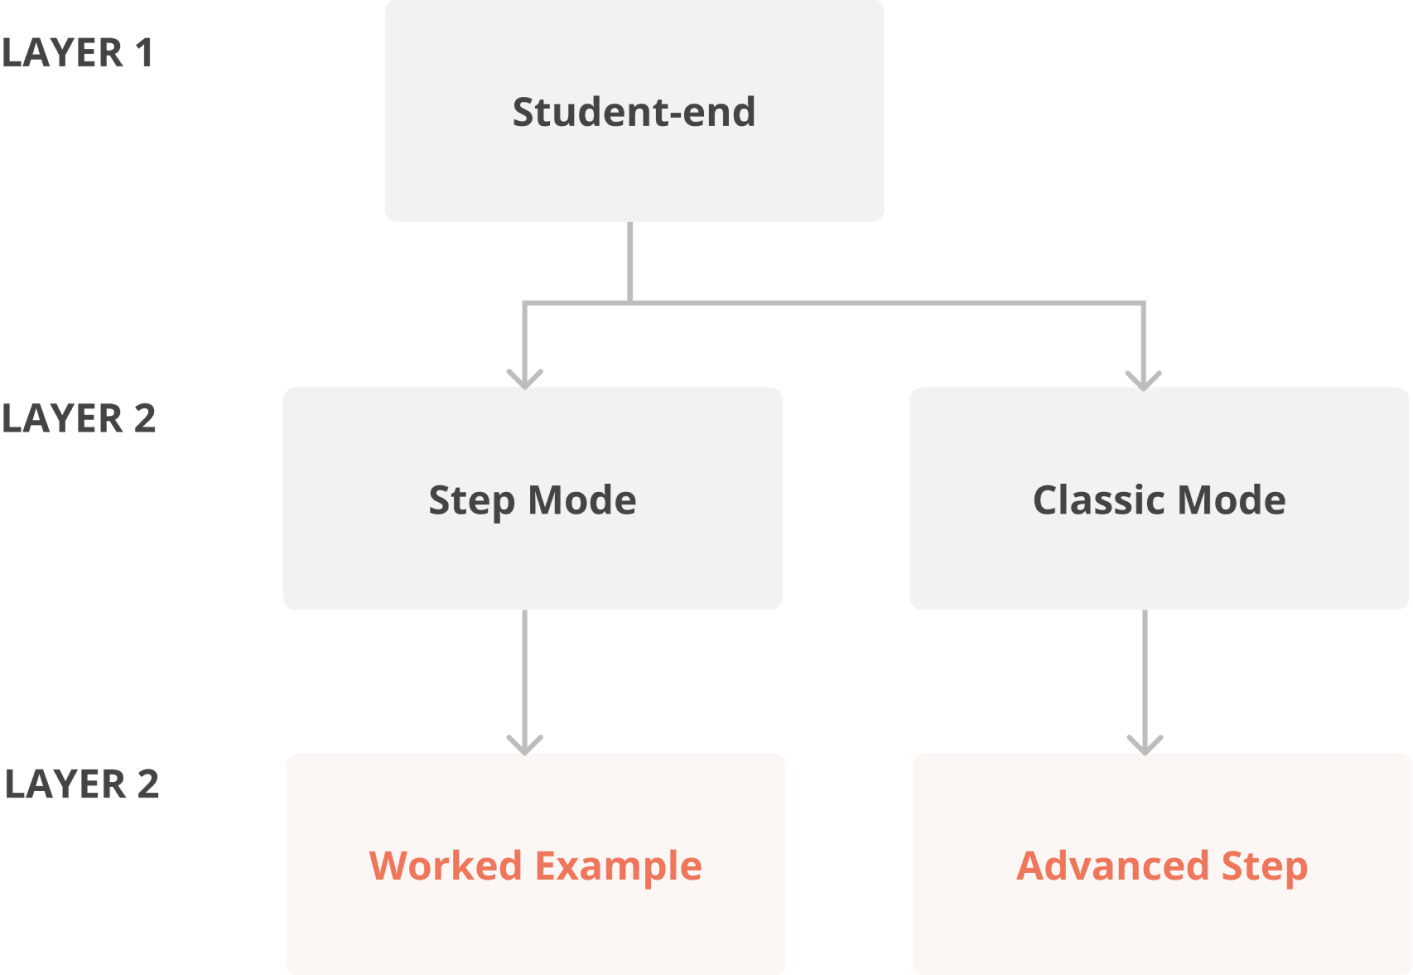
From May to August, we ran through 4 rounds of iterations.
In the first round, we interviewed both teachers and students, tested and updated the information architecture of the whole product. From 2nd round, we focused more on three core features on the teacher end: Checkpoints, Project and Class Summary. In the following session, we will talk about our iterations in product structure, features, and metrics.

1. How we display student data/information to teachers

Communicating with real-time data is more about telling a specific story, it’s about starting a guided conversation with targeted audience. We did rounds of structure iterations to explore the form we should take, the navigation and interactions that make our dashboard useful and engaging for teachers.

Round 1: Low-fi Teacher Interface

Information Architecture

When doing sketch work and low-fi version, we put all the tabs teachers might need in the classtime of the same layer.

Round 2: Mid-fi Teacher Interface

Information Architecture

In the mid-fi version, we made each tab appeared over time since we realized that teachers don’t need to go back to prior session during one class.

Round 3: High-fi Teacher Interface

Information Architecture

To reach full flexibility to teachers, we designed the final version as shown below.

2. Different practicing modes for students

Students’ prior knowledge varies largely. Many students have taken after-class courses outside of the school but some didn't. We did rounds of iteration to figure out how to build a inclusive practice system for students.

Round 1: Low-fi Student Interface

We designed this Low Fidelity student interface of the step by step practice mode and brought it to teacher and students to test.

Findings Teachers want students to be able to think independently before they get access to more scaffolding (step mode)

Round 2: Mid-fi Student Interface

In-class Practice

A Combination of step and classic mode for students to choose from, instead of only the step mode. Prompts are added to remind students to switch to step mode when they get stuck for too long.

Round 3: Hi-fi Student Interface

In-class Practice

Code from classic mode will be kept as reference when students switch from classic mode to step mode, also, we added worked example and advanced step features.

3. Students’ Status Visualization

From mountain chart to dot chart, to a combination of classroom and student individual activity monitor, we iterated the overall classroom and student status visualization based on their needs and priorities.

Round 1: Low-fi Teacher Interface

Practicing Progress Monitor

Mountain chart
Our assumption: it might be more important for teachers to see an overview of the class status

Round 2: Mid-fi Teacher Interface

Practicing Progress Monitor

Dot visualization to show a comprehensive overview of students’ learning data.

Finding
Teachers want to see both overview and each student's activities. However, some have more than 50 students in one class. It's challenging for teachers to see all the dots then.

Round 3: Hi-fi Teacher Interface

Practicing Progress Monitor

Add the detailed student list.

Finding
Teachers would prefer to see a list of students.

4. Support on Student End

With more than 50 students working behind screens in one classroom, teachers may find it challenging to make the strong connections to get to know each student. By iterating system support on the student end, we provide more types of support besides teacher’s personal intervention.

Round 1: Low-fi Student Interface

One-size-fits-all hints is not that useful to students since they have diverse different mistakes.

Round 2: Mid-fi Student Interface

Customized feedback based on test cases.

Round 3: Hi-fi Student Interface

Apart from giving customized feedback to those who submitted their codes, we also added worked examples for students who are clueless.

5. Checkpoint Questions

How to keep students be on the same page when listening to lectures? Is personalized learning possible during the lecture time? How to do formative assessment to check their understanding? What information do teachers want to know to support their course adjustment? We iterated this part guided by these needs from both student and teacher sides.

Round 1: Low-fi Teacher Interface

The check-point question dashboard was originally included in the in-class practice dashboard interface.

Round 2: Mid-fi Teacher Interface

Displayed on the side of the lecture slides

Finding
Teachers tend to think it’s a side feature apart from the lecture slides and presentation, so it might not need to be much of an emphasis on the interface

Round 3: Mid-fi Teacher Interface

Teachers want to see the best and worst answering students.

Round 3: Hi-fi Teacher Interface

Teachers want to share extra materials according to the answer summary

Findings
• “I want to be able to do something after students fail to answer the checkpoint questions”
• “For some individuals that answer the questions indirectly, I might not be able to explain in front of all students, so I want to share some materials to them.”

Round 4: Hi-fi Teacher Interface

Teachers want to compare with others to have a better sense of how his students are doing.

Finding
Add comparison to other classes’ answer summary to the questions.

6. Class Summary

A pure-text report that can only download? A classroom-level report with historical performance comparison? A student individual report with their off-task reminders .......
What do teachers really need to do data-informed reflection? How can we help teachers reduce low-level disruption? We iterated our auto-generated reports to try to find answers for these two leading questions.

Round 1: Low-fi Teacher Interface

Teacher wants more hierarchy on information displayed

Round 2: Mid-fi Teacher Interface

We added the following information based on teachers’ needs and comments.
• Average score (score for different modes)
• Common problems (Analysis)
• # of students who finished the project (active categorization)

Finding
Teachers want more hierarchy on information displayed.

Round 3-1: Hi-fi Teacher Interface

We added the following information based on teachers’ needs and comments.
• Resources shared • Feedback given to students

Finding
Teacher wants to review not only students’ own behaviors but also his own teaching interventions, actions.

Round 3-2: Hi-fi Teacher Interface

In-class Learninng Analytical Dashboard

We added the following information based on teachers’ needs and comments.
• Remaining help list: keep unsolved questions
• Common problem status: solved / unsolved

Finding
Want to give some after-class intervention to students who still need help.

Iteration Round 3-3: Hi-fi Teacher Interface

We made some revisions on the visual presentation.
• Use mode icons to show practice journey
• Use progress bar to visualize test score level & lower cognitive load

Finding
• Visualization: More visual friendly • Visualization: More understandable • Goal: Internalize it quickly.

7. Metric Iteration

ITAP -> Test Cases -> Test Cases + AST Matching

ITAP

(Intelligent Teaching Assistant for Programming)

Usage
Use ITAP to provide auto-generated hints and evaluate students’ code
Drawback
The hints are too explicit, not good for students’ independent thinking

Test Cases

Usage
Use test cases to evaluate students’ code and provide targeted feedback to students’ errors
Drawback
Cannot explicitly assess the skills taught in the class

Test Case + AST Matching

AST Matching can detect if students have used a certain skill in their code and provide a better aligned assessment of their performance